IC Time Recoder
2020-2021
- Vue.js and charts
- Full-Stack Development
- Vue.js, Chartjs, JavaSpringBoot, GraphQL...
Transform Your Data into Stunning Visuals with Ease.
Chart.js is a simple tool that allows you to add graphs and charts to your website. For instance, you can easily create bar graphs or pie charts that we often see. This tool is designed to look great on web pages and automatically adjusts its size to look good on various devices like phones and computers. This means you can see clean and easy-to-understand charts on any screen. 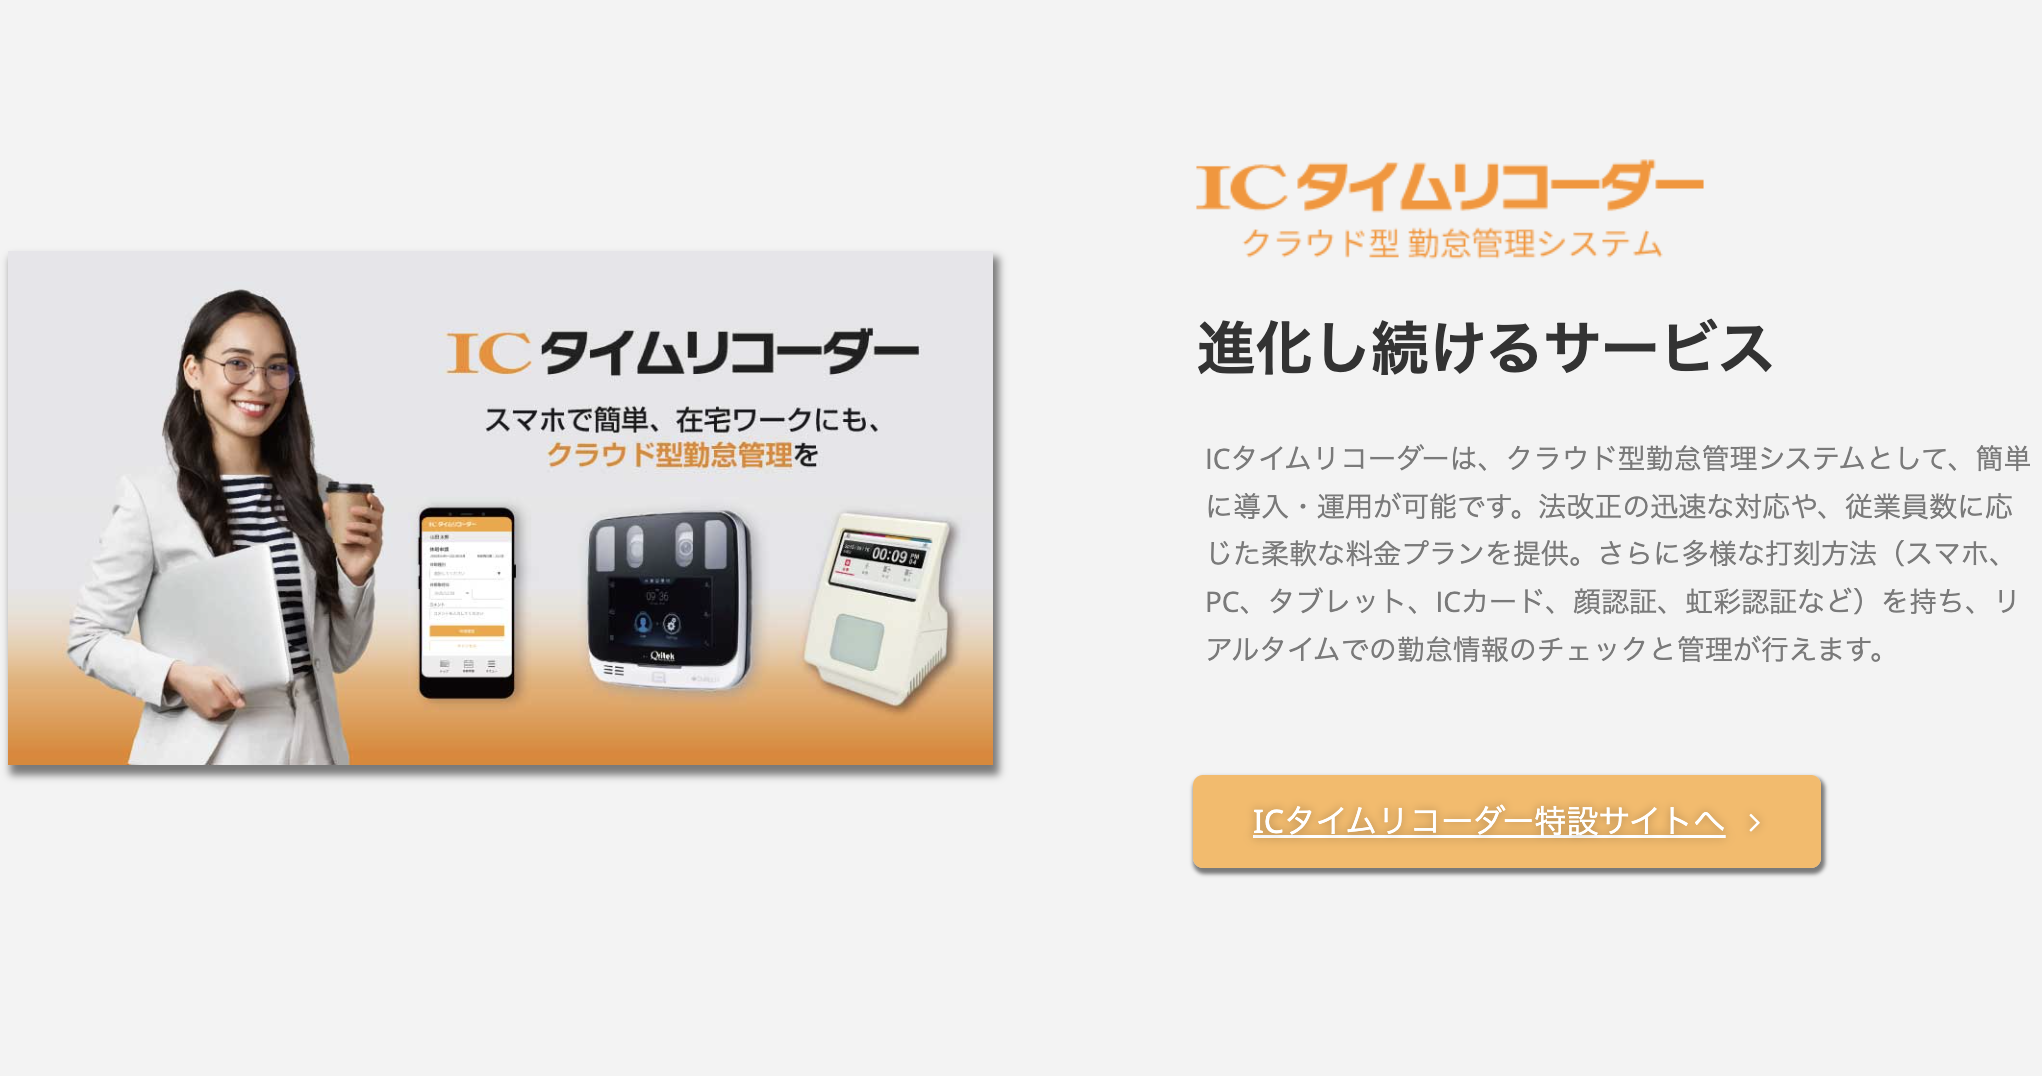 Using Chart.js, you can visually represent complex data. When we input data through code, Chart.js transforms it into beautiful graphs. This makes our data easier to understand and clearly conveys information to the viewer. This tool is incredibly useful in web development and is optimized for visualizing data.
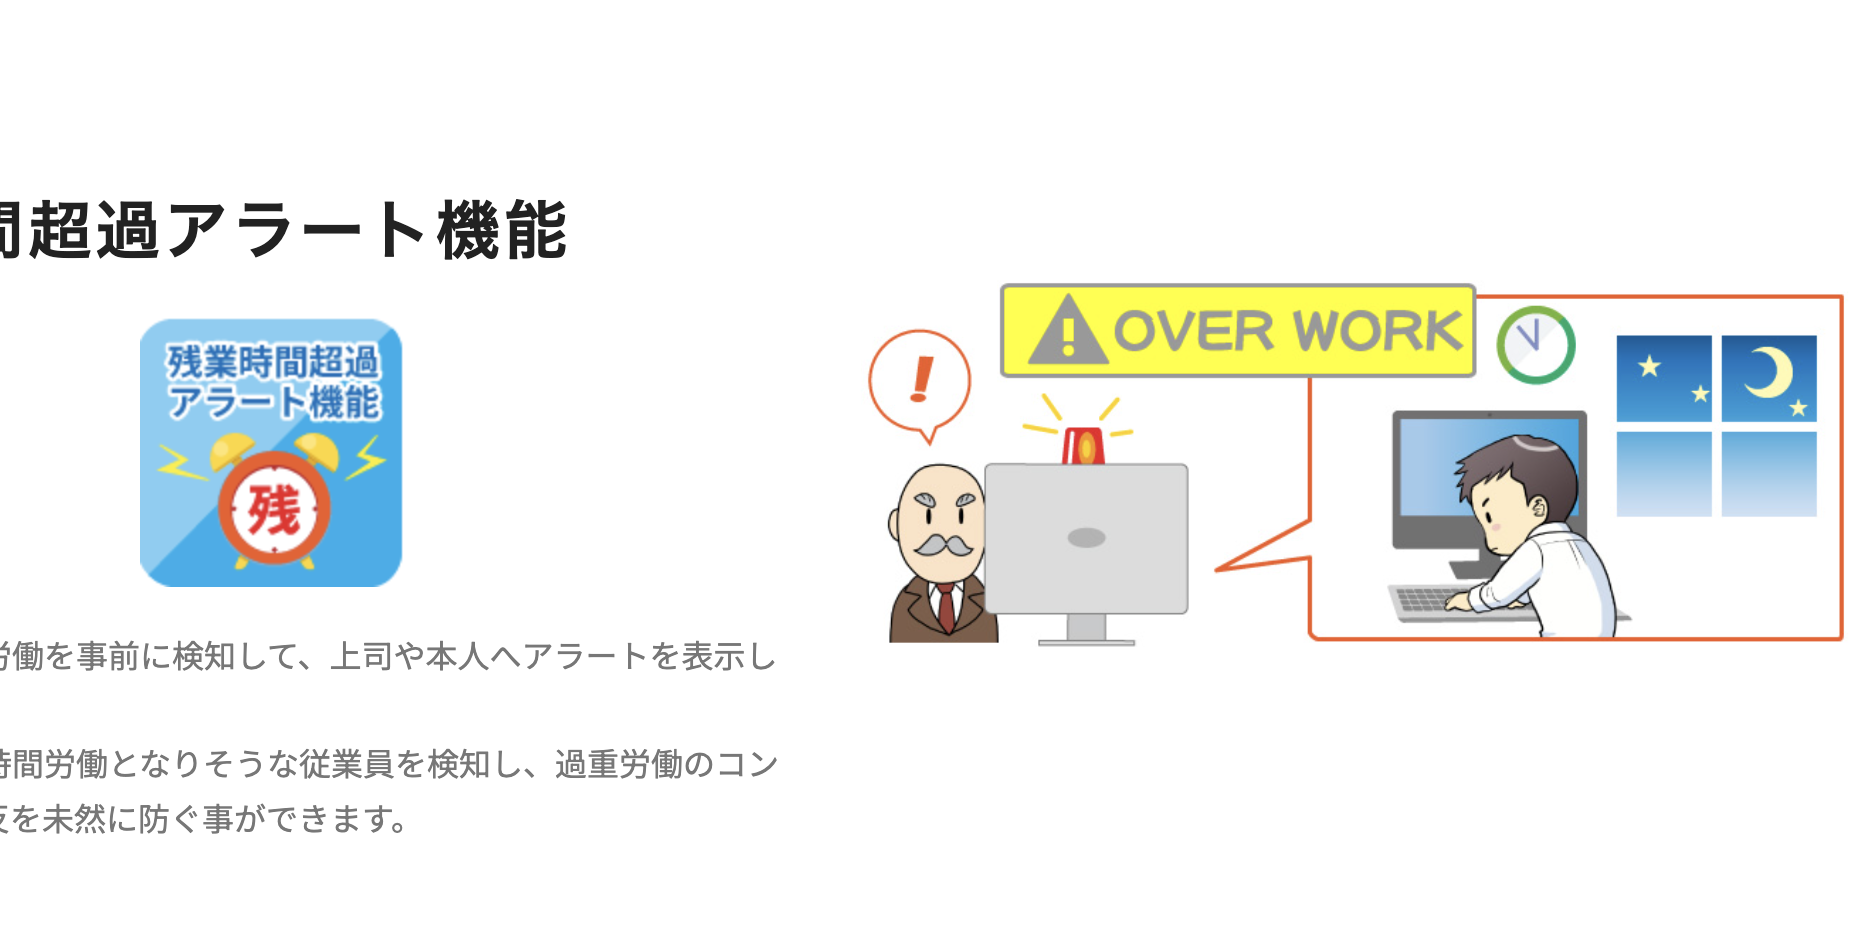
Using Chart.js, you can visually represent complex data. When we input data through code, Chart.js transforms it into beautiful graphs. This makes our data easier to understand and clearly conveys information to the viewer. This tool is incredibly useful in web development and is optimized for visualizing data. The attendance management data visualization charts, highly praised by our sales team, enhance convenience for managers, making their tasks easier to handle.
This feature is provided as a separate microservice connected via JWT tokens, and its dedicated page uses Vue2 and Chart.js to display all information related to attendance in a concise and easy-to-understand manner.
Our team has developed visualization features using chart functionality to make our attendance management application even easier to use. Since it’s a corporate-exclusive page, I can’t show it to you, but if you’re interested in learning more about data visualization and charts, please check out my other project, the ‘Rakuten Household Account Book Application’!